Build the Single stage RC circuit shown in Fig. 2, with
Fig. 2: (left) schematic of the single stage RC circuit, (right) implementation on breadboard.
Analysis
The claimed transfer function of this circuit is
Where j=−1 is the imaginary unit.
- What is the magnitude of the transfer function?
- What is the phase response of the circuit?
- What class (low-pass, high-pass, band-pass, band-stop) of filter is this? (This is equivalent to asking what happens to |T(f)| as f gets lower or higher?)
- At what frequency does |T(f)|=12≈0.707? (This corresponds to the so-called “half power point” where the ratio of the input to output power is 2 (-3dB) – The circuit drops half of the total power) This value is generally referred to the “cutoff frequency” or “-3dB frequency” and is represented by .
- (optional) What would happen if I swapped the input and output ports?
(Hint: is there any current flowing through the resistor?)
Measurement
Using the Red Pitaya’s Bode Analyzer tool, measure the frequency response (|T(f)|).
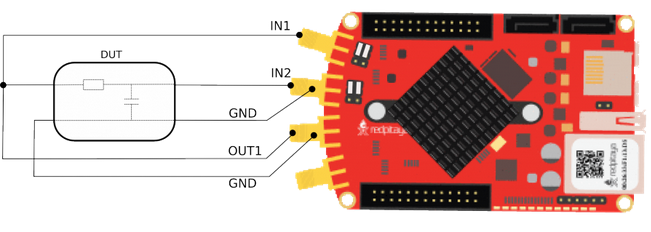
- Connect the Red Pitaya to the circuit, also known as the Device Under Test (DUT)), as shown below
- Connect to the Red Pitaya and select the Bode Analyzer tool.
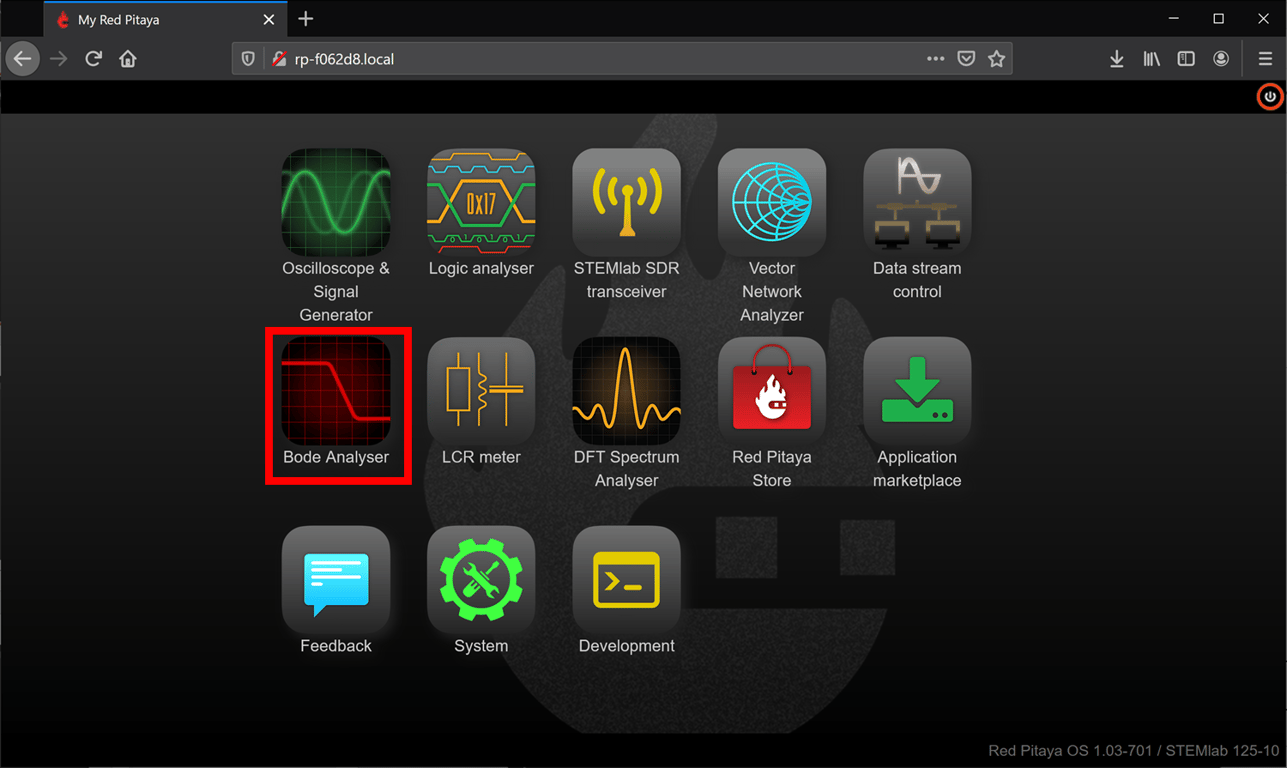
A more detailed description of the Bode analyzer can be found here: Bode Analyzer
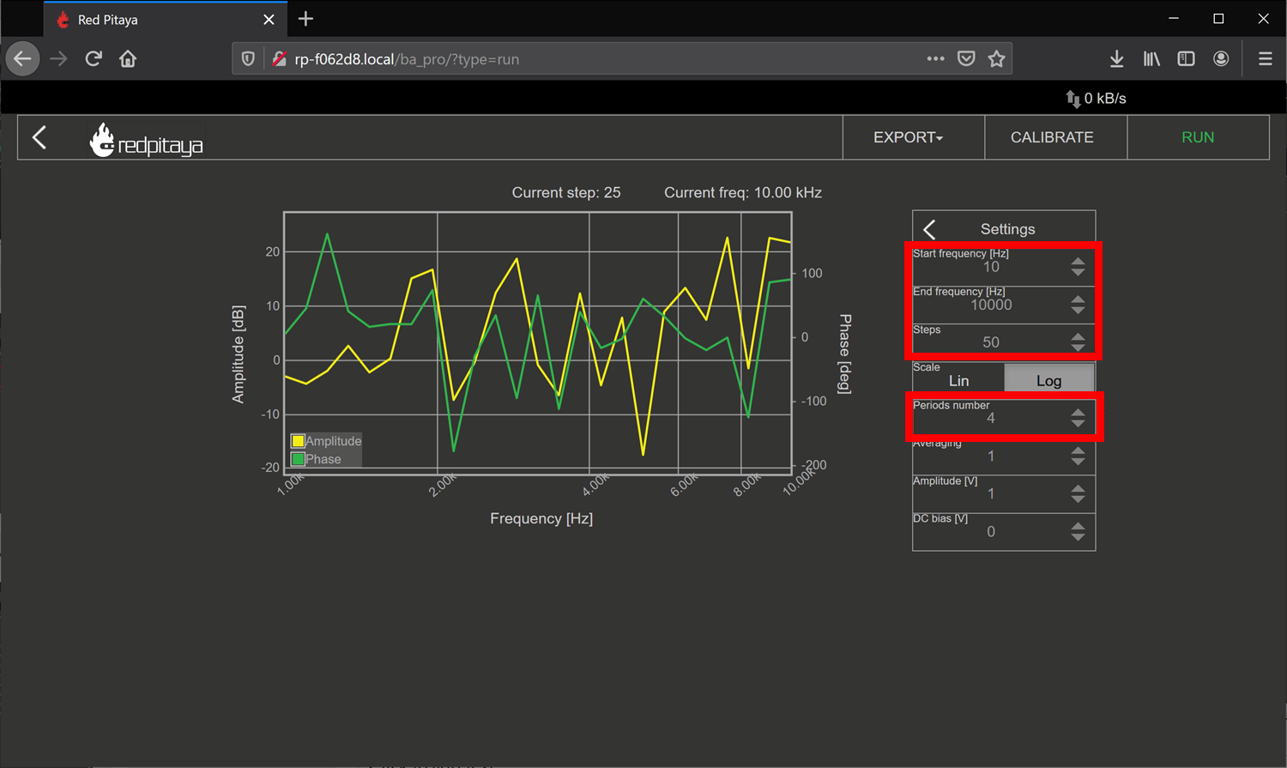
- Click on the settings box to access the sweep settings
- Configure the settings as shown below, we will find new sweep values as we go on, but these should be safe values to try
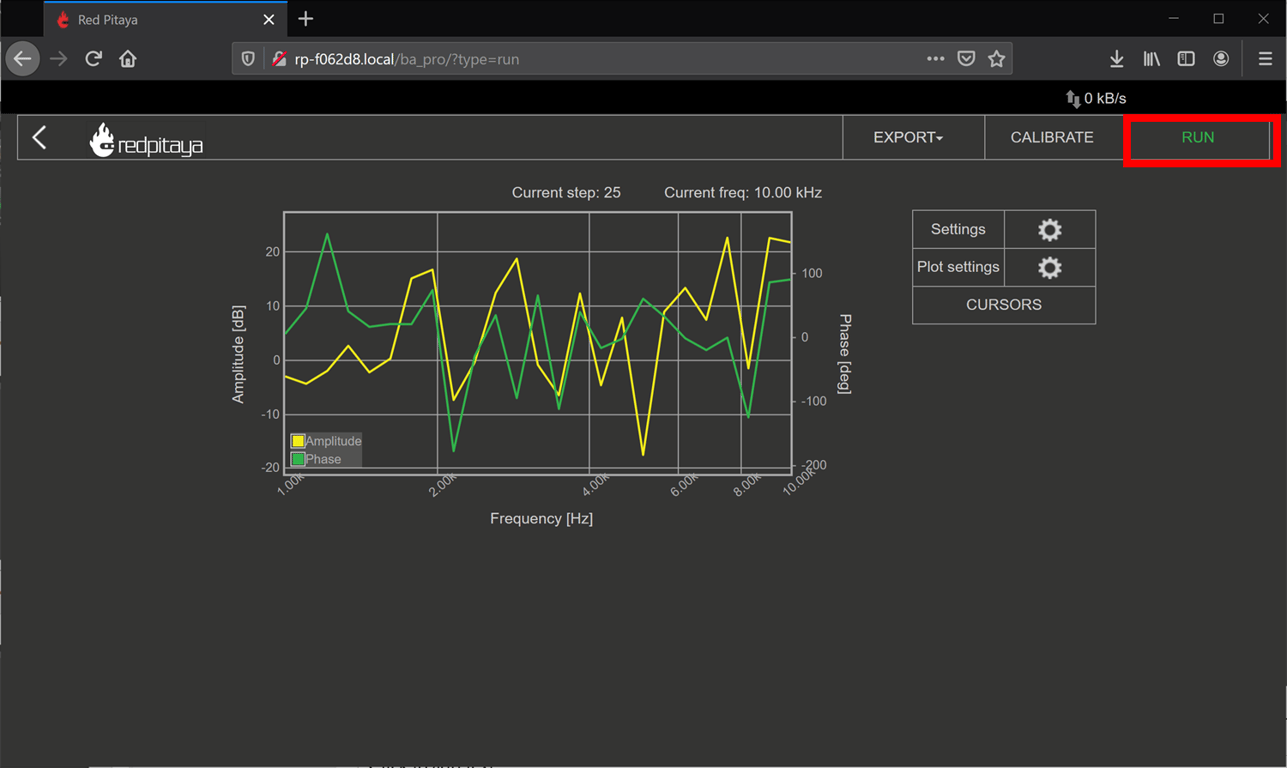
- Click RUN – The sweep can take awhile to complete.
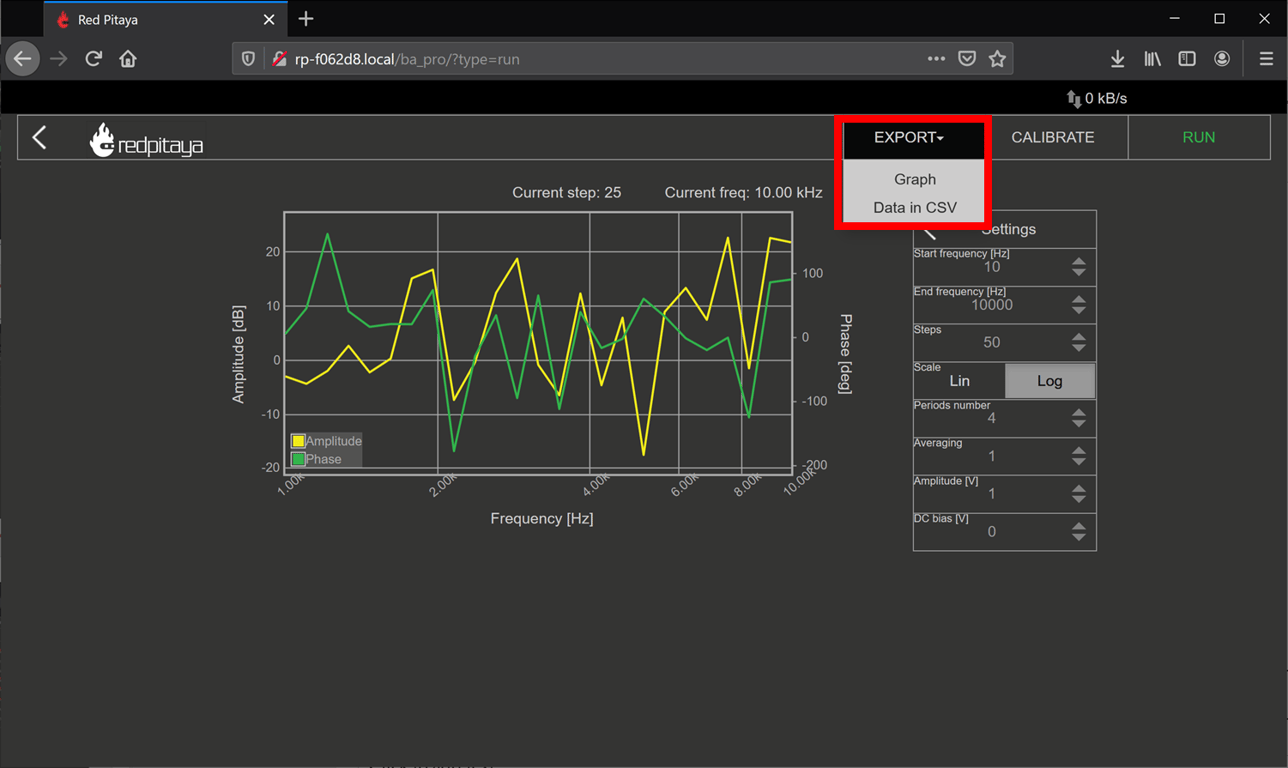
- To export data: click the Export tab, and either select Graph for a PNG of the chart, or CSV for the raw CSV data of the plot.
Comparison
Respond to the following questions:
- Does the shape of the frequency response match your expectation from the analysis? Is there any point that stands out as odd?
- Find the -3dB point in the circuit, and compare this value to the one you previously calculated.
 Made with Bullet