Getting Started:
Setting Up SCPI communicationℹ️ Instructions and Information
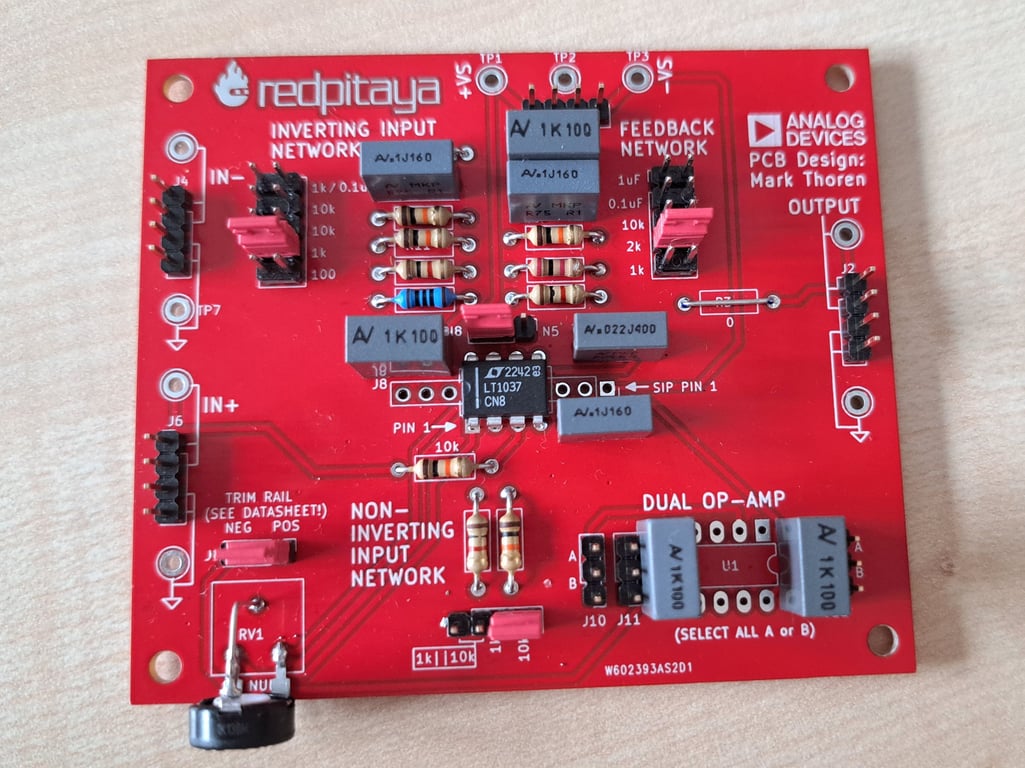
OpAmp Experimenter Board
This Python script demonstrates how to use SCPI commands with a Red Pitaya board to generate a sine wave signal, acquire it through its analog inputs, calculate the gain between two input channels, determine if the operational amplifier (op-amp) configuration is inverting or non-inverting based on the phase relationship, and finally plot the acquired data. The script leverages the
redpitaya_scpi Python package for SCPI communication. Additionally we upgrade the code so it find the -3db point automatically.❕Requirements
- Red Pitaya STEMlab or similar model
- Network connectivity between the Red Pitaya and the computer running this script
numpyandmatplotlibPython packages for data processing and visualization
redpitaya_scpiPython package for SCPI communication with the Red Pitaya
✍️ Step-by-Step Instructions
- Establish Connection: The script starts by establishing a SCPI connection to the Red Pitaya using its IP address.
- Signal Generation Setup: Configure the Red Pitaya to generate a sine wave signal with specified frequency and amplitude. The signal is generated on Output 1.
- Acquisition Setup: Prepare the Red Pitaya to acquire signals on both Input 1 and Input 2. This includes setting the gain, data format, units, decimation rate, and trigger level for acquisition.
- Start Acquisition: Begin the data acquisition process and wait for the specified trigger condition to be met.
- Data Reading: Once triggered, the script reads the full data buffer from both Input 1 and Input 2.
- Data Processing: The raw string data from each input is processed to convert it into a list of floating-point numbers.
- Gain and Configuration Determination: Calculates the gain between Input 2 and Input 1 and uses cross-correlation to determine if the op-amp configuration is inverting or non-inverting.
- Data Plotting: Plot the acquired data from both inputs on the same graph for visual comparison.
- Clean Up: Closes the SCPI connection to the Red Pitaya.
▶️ Running the Script
Ensure your Red Pitaya is powered on, connected to the same network as your computer, and has SCPI server running. Replace the IP address in the script with your Red Pitaya's IP address, then run the script in an environment where all the required packages are installed.
🔧 Troubleshooting
- SCPI Connection Issues: Verify network connectivity and ensure the correct IP address is used.
- Library Not Found Errors: Ensure all required Python packages (
numpy,matplotlib,redpitaya_scpi) are installed in your environment.
- Data Acquisition Issues: Check the trigger level and decimation settings if the script does not trigger or acquires unexpected data.
🧠 Code and Explanation
Connection Setup
First, establish a connection to the Red Pitaya using its IP address through the SCPI protocol. This step is crucial for enabling remote control over the device.
import redpitaya_scpi as scpi

IP = '169.254.242.31'  # Replace with your Red Pitaya's IP address
rp_s = scpi.scpi(IP)
Signal Generation Configuration
Configure the Red Pitaya to generate a sine wave signal. This involves resetting the generator to its default state, setting the waveform type to sine, defining the frequency and amplitude, and enabling the output.
freq = 1000  # Frequency of sine wave in Hz
ampl = 1     # Amplitude of sine wave in Volts

rp_s.tx_txt('GEN:RST')
rp_s.tx_txt(f'SOUR1:FUNC SINE')
rp_s.tx_txt(f'SOUR1:FREQ:FIX {freq}')
rp_s.tx_txt(f'SOUR1:VOLT {ampl}')
rp_s.tx_txt('SOUR1:TRIG:SOUR INT')
rp_s.tx_txt('OUTPUT1:STATE ON')
rp_s.tx_txt('SOUR1:TRIG:INT')
Acquisition Configuration
Prepare the device for signal acquisition by resetting the acquisition settings and configuring parameters such as gain, data format, units of measurement, decimation rate, and the trigger level for both input channels.
rp_s.tx_txt('ACQ:RST')
rp_s.tx_txt('ACQ:SOUR1:GAIN HV')  # High voltage gain for Input 1
rp_s.tx_txt('ACQ:SOUR2:GAIN HV')  # High voltage gain for Input 2
rp_s.tx_txt('ACQ:DATA:FORMAT ASCII')
rp_s.tx_txt('ACQ:DATA:UNITS VOLTS')
rp_s.tx_txt('ACQ:DEC 16')        # Decimation
rp_s.tx_txt('ACQ:TRIG:LEV 0.4')  # Trigger level
Trigger and Acquisition Start
Begin the data acquisition process, wait for the acquisition to start, and then wait for the trigger condition to be met.
rp_s.tx_txt('ACQ:START')
time.sleep(0.5)  # Allow some time for the acquisition to start
rp_s.tx_txt('ACQ:TRIG CH1_PE')  # Set trigger on positive edge for Channel 1
Data Reading and Processing
After triggering, read the full data buffer from both input channels, process the raw string data into numerical data, and calculate the gain and determine the configuration of the op-amp.
# Read data from Input 1
rp_s.tx_txt('ACQ:SOUR1:DATA?')
data_string0 = rp_s.rx_txt()  # Data in string format
data0 = list(map(float, data_string0.strip('{}\n\r').replace("  ", "").split(',')))

# Read data from Input 2
rp_s.tx_txt('ACQ:SOUR2:DATA?')
data_string1 = rp_s.rx_txt()  # Data in string format
data1 = list(map(float, data_string1.strip('{}\n\r').replace("  ", "").split(',')))
Gain Calculation and Configuration Determination
Calculate the gain between the two channels and use cross-correlation to identify if the op-amp configuration is inverting or non-inverting.
def determine_opamp_properties(data1, data2):
    p2p_input = np.ptp(data1)
    p2p_output = np.ptp(data2)
    gain = p2p_output / p2p_input

    correlation = np.correlate(data1, data2, "full")
    max_corr_index = np.argmax(correlation)
    mid_index = len(data1) - 1

    if max_corr_index > mid_index:
        opamp_type = "Inverting"
    else:
        opamp_type = "Non-Inverting"

    return gain, opamp_type

gain, opamp_type = determine_opamp_properties(data0, data1)
Plotting
Visualize the acquired data from both channels on a graph to compare and analyze the signals.
pythonCopy code
import matplotlib.pyplot as plt

plt.plot(data0, color='blue', label='Input 1')
plt.plot(data1, color='red', label='Input 2')
plt.xlabel('Sample Number')
plt.ylabel('Voltage (V)')
plt.legend()
plt.show()
Close the connection
rp_s.close()
Full code
import numpy as np
import redpitaya_scpi as scpi
import time
import matplotlib.pyplot as plt

# Establish connection
IP = '169.254.242.31'
rp_s = scpi.scpi(IP)

freq = 1000
ampl = 1

# Setup for source output
rp_s.tx_txt('GEN:RST')
rp_s.tx_txt(f'SOUR1:FUNC SINE')
rp_s.tx_txt(f'SOUR1:FREQ:FIX {freq}')
rp_s.tx_txt(f'SOUR1:VOLT {ampl}')

rp_s.tx_txt('SOUR1:TRIG:SOUR INT')
rp_s.tx_txt('OUTPUT1:STATE ON')
rp_s.tx_txt('SOUR1:TRIG:INT')

# Acquisition setup for both inputs
rp_s.tx_txt('ACQ:RST')
rp_s.tx_txt('ACQ:SOUR1:GAIN HV') # Setting up gain for input 1
rp_s.tx_txt('ACQ:SOUR2:GAIN HV') # Setting up gain for input 2
rp_s.tx_txt('ACQ:DATA:FORMAT ASCII')
rp_s.tx_txt('ACQ:DATA:UNITS VOLTS')
rp_s.tx_txt('ACQ:DEC 16') # Decimation
rp_s.tx_txt('ACQ:TRIG:LEV 0.4') # Trigger level

rp_s.tx_txt('ACQ:START')
time.sleep(0.5)

# Trigger setup for both inputs
rp_s.tx_txt('ACQ:TRIG CH1_PE') # Setting trigger for input 1
#rp_s.tx_txt('ACQ:TRIG CH2_PE') # Setting trigger for input 2

# Wait for the trigger
while True:
    rp_s.tx_txt('ACQ:TRIG:STAT?') # Get Trigger Status
    if rp_s.rx_txt() == 'TD':     # Triggered?
        break

# Reading data from both inputs
rp_s.tx_txt('ACQ:SOUR1:DATA?') # Read full buffer from input 1
data_string0 = rp_s.rx_txt()   # Data from input 1 into a string

rp_s.tx_txt('ACQ:SOUR2:DATA?') # Read full buffer from input 2
data_string1 = rp_s.rx_txt()   # Data from input 2 into a string

# Process data from both inputs
data_string0 = data_string0.strip('{}\n\r').replace("  ", "").split(',')
data0 = list(map(float, data_string0)) # Transform data from input 1 into float

data_string1 = data_string1.strip('{}\n\r').replace("  ", "").split(',')
data1 = list(map(float, data_string1)) # Transform data from input 2 into float

def determine_opamp_properties(data1, data2):
    # Calculate gain
    p2p_input = np.ptp(data1)  # Peak-to-peak for input
    p2p_output = np.ptp(data2) # Peak-to-peak for output

    # Calculate gain
    gain = p2p_output / p2p_input

    # Determine inverting or non-inverting
    # Here, we use cross-correlation to check the phase relationship
    correlation = np.correlate(data1, data2, "full")
    max_corr_index = np.argmax(correlation)
    mid_index = len(data1) - 1

    if max_corr_index > mid_index:
        opamp_type = "Inverting"
    else:
        opamp_type = "Non-Inverting"

    return gain, opamp_type

gain, opamp_type = determine_opamp_properties(data0, data1)
print(f"Gain (Input2/Input1): {gain}")
print(f"Op-Amp Circuit Type: {opamp_type}")

# Plotting data from both inputs
plt.plot(data0, color='blue', label='Input 1')  # Plot Input 1 in blue
plt.plot(data1, color='red', label='Input 2')  # Plot Input 2 in red
plt.xlabel('Sample Number')
plt.ylabel('Voltage (V)')
plt.legend()

plt.show()

rp_s.close()
 Made with Bullet